I have been using VSCode for at least six years, and one of my struggles has always been "how to debug things inside the editor".
I always thought it was overcomplicated, and to be honest, I still have this feeling. I understand the variety of ways of running an application in any language makes the task of "creating something generic enough" really difficult, but still, things could be easier.
Today, I gave it another shot on this task to see what it looks like, and I believe either things got easier or, after all those years, my brain got in the right shape to reason about that 😅.
Regular workflow
My main programming language is JavaScript/Typescript. I do play with other programming languages, but 95% of the time, I'm somewhere either debugging in the browser or in Node.JS.
That means when I run an application, I often run a npm script, such as dev:
npm run dev
# or
pnpm run dev
# or
bun run dev
This will either run a web server or run some files in watch mode.
When I'm using a browser (client code), I can simply add the debugger keyword, and when I open the browser console and reach that code, the debug will start so I can understand how things are going, but what about the server code?
My wish is simple: "Can I run the same command, add a breakpoint in VSCode, and auto-enable the debugger?"
Launch file and setup
In VSCode, there's a tab called "Run and Debug":
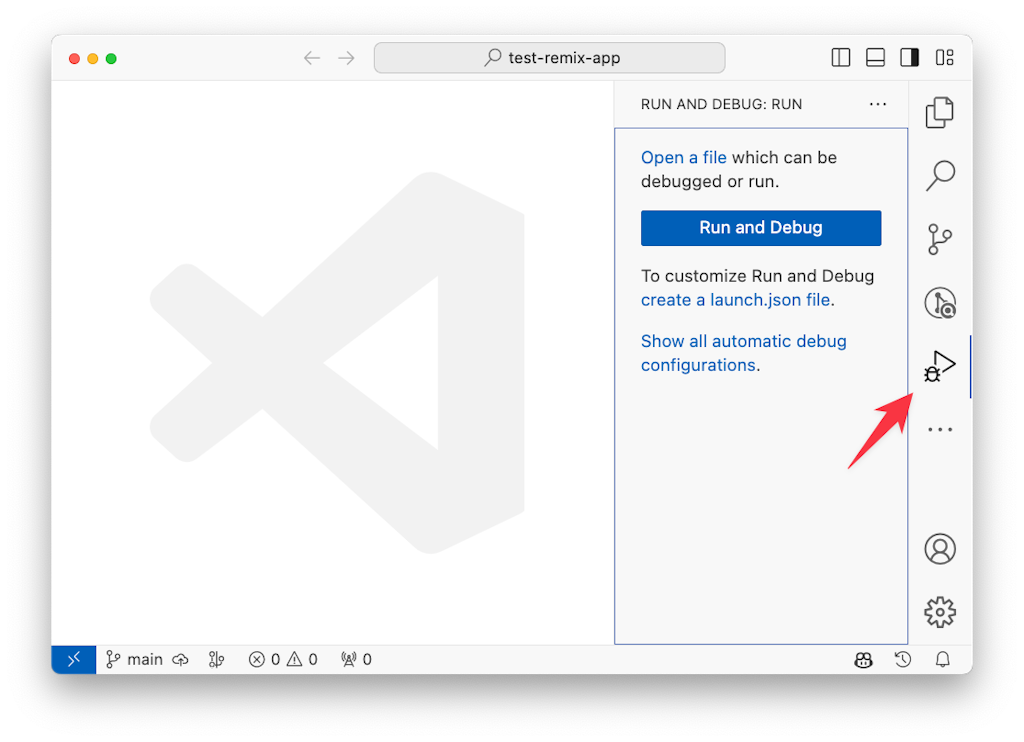
It'll be empty if you don't have a launch.json file in the repository.
To create one, you can press the "create a launch.json file" button, and a dialog with some options will show up:
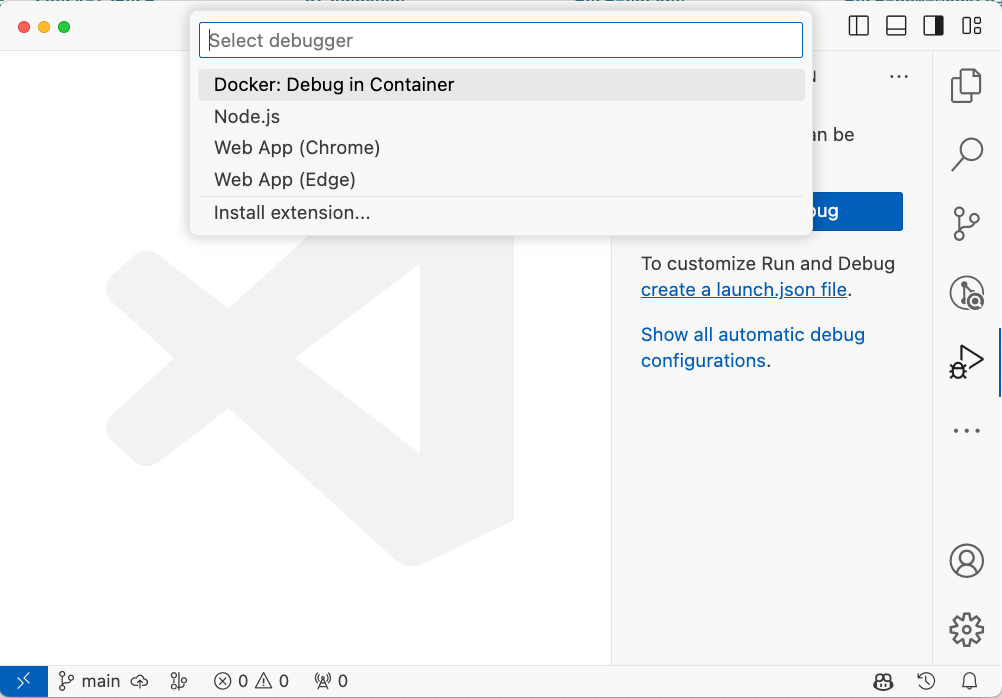
You might think: "Oh, it's a node application, maybe I can pick this option". The assumption is right, but when you select it, you'll get the following setup:
{
  // Use IntelliSense to learn about possible attributes.
  // Hover to view descriptions of existing attributes.
  // For more information, visit: https://go.microsoft.com/fwlink/?linkid=830387
  "version": "0.2.0",
  "configurations": [
    {
      "type": "node",
      "request": "launch",
      "name": "Launch Program",
      "skipFiles": [
        "<node_internals>/**"
      ],
      "program": "${file}"
    }
  ]
}
And that's not... what I want to run. In fact, that is not what I do daily when I run a project.
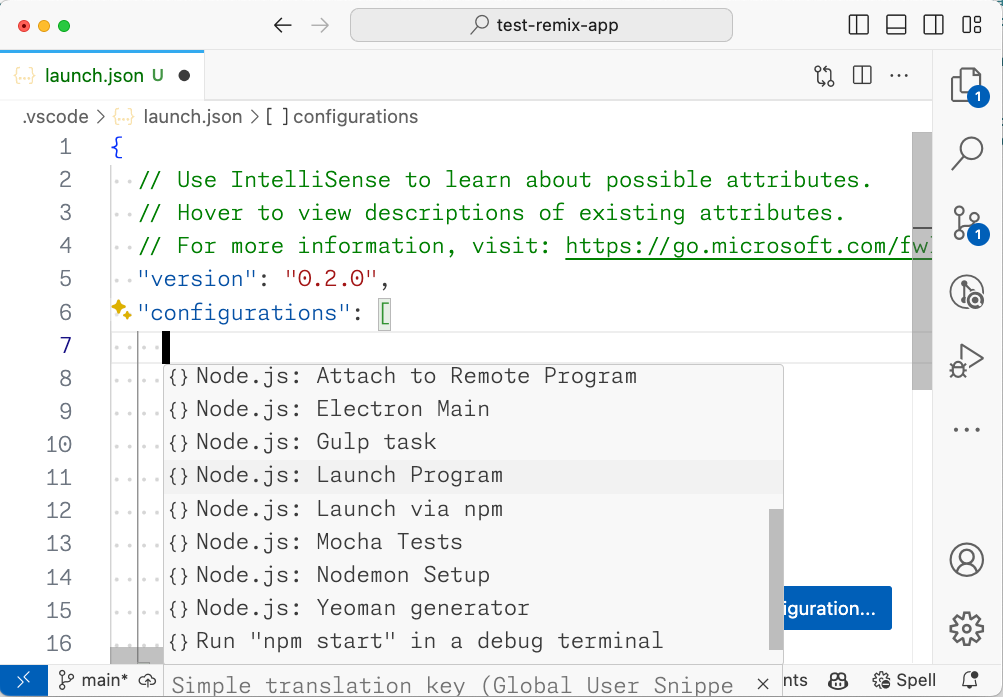
When you open the launch.json file, you'll see a button labeled "Add Configuration..." and when you click, you'll see more interesting options.
The option I want is "Node.js: Launch with npm":
I often use other package managers/runners other than npm to run my apps, but that's exactly what I need.
If I select this option, a new configuration will be added to the array with the following shape:
   {
      "name": "Launch via NPM",
      "request": "launch",
      "runtimeArgs": [
        "run-script",
        "debug"
      ],
      "runtimeExecutable": "npm",
      "skipFiles": [
        "<node_internals>/**"
      ],
      "type": "node"
    }
There are 2 important bits here:
- On line 8, we specify the runner. It could be yarn, bun, pnpm, or whatever you use to run your application
- on lines 4 to 7, we specify the npm script and some arguments.
This will be equivalent to running npm run-script debug in your terminal.
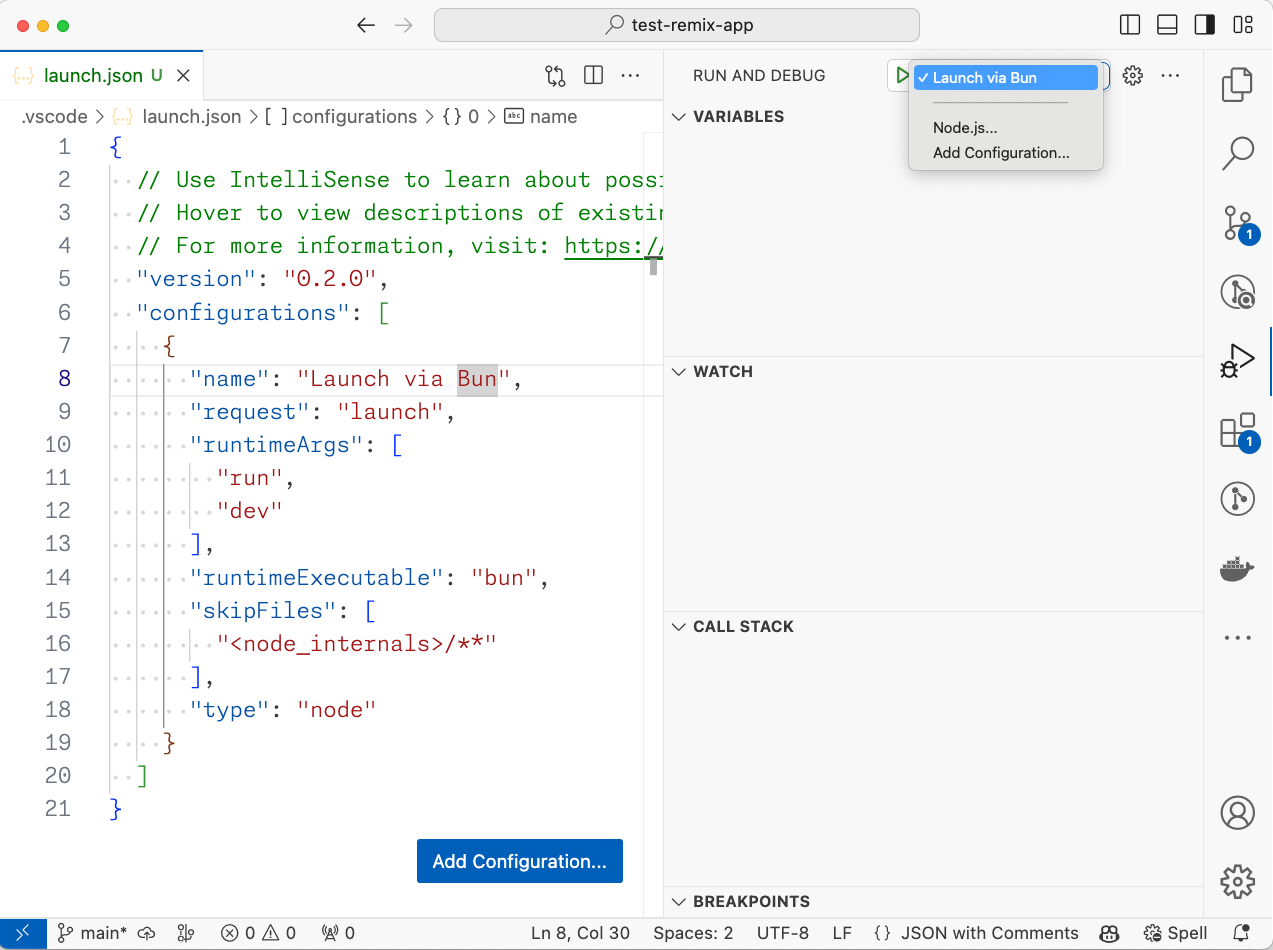
Changing this setup to a command like "bun run dev", the launch configuration would look like this:
 {
      "name": "Launch via Bun",
      "request": "launch",
      "runtimeArgs": [
        "run",
        "dev"
      ],
      "runtimeExecutable": "bun",
      "skipFiles": [
        "<node_internals>/**"
      ],
      "type": "node"
    }
Now, in the debug tab, the configuration we just created will show up as an option:
When I press "play", it'll run this command, and my web server will start. You'll see that VSCode will add some extra buttons and a visual indication that the debugger is running, like a top action bar to pause/stop/run/skip breaking points and a red bottom bar:
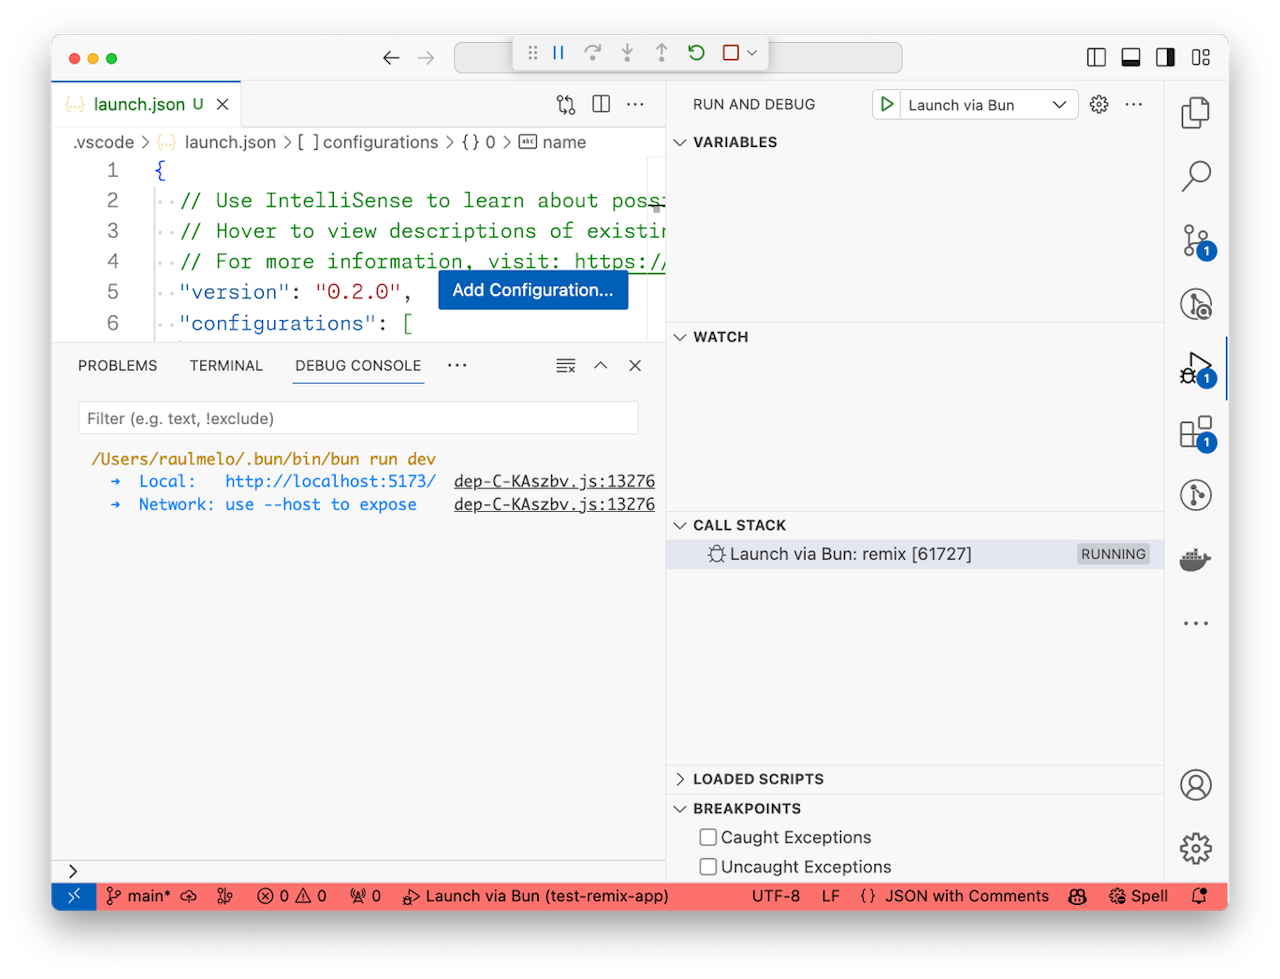
Also, instead of accessing the Terminal tab (in case you use the VSCode terminal), you'll see the consoles in the "Debug Console" tab.
Opening the application, everything works as I expect:
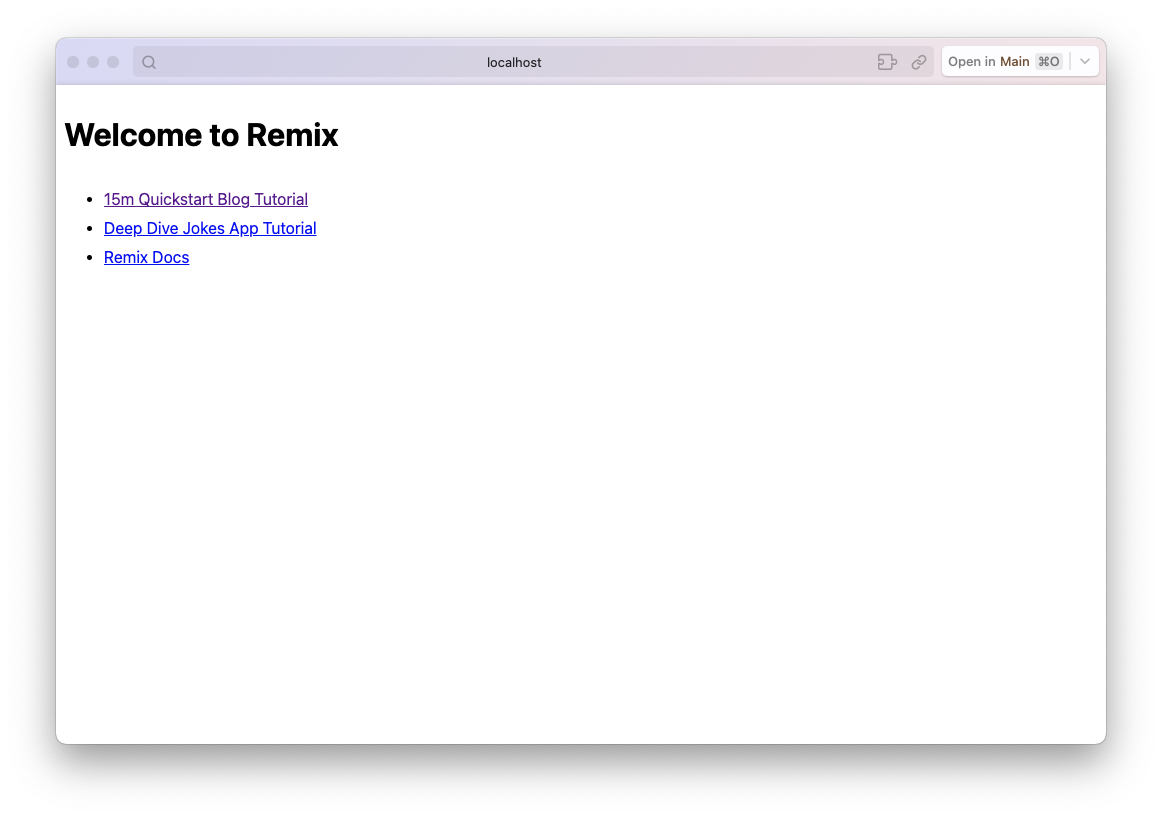
Now, it's time to test the editor's breaking point.
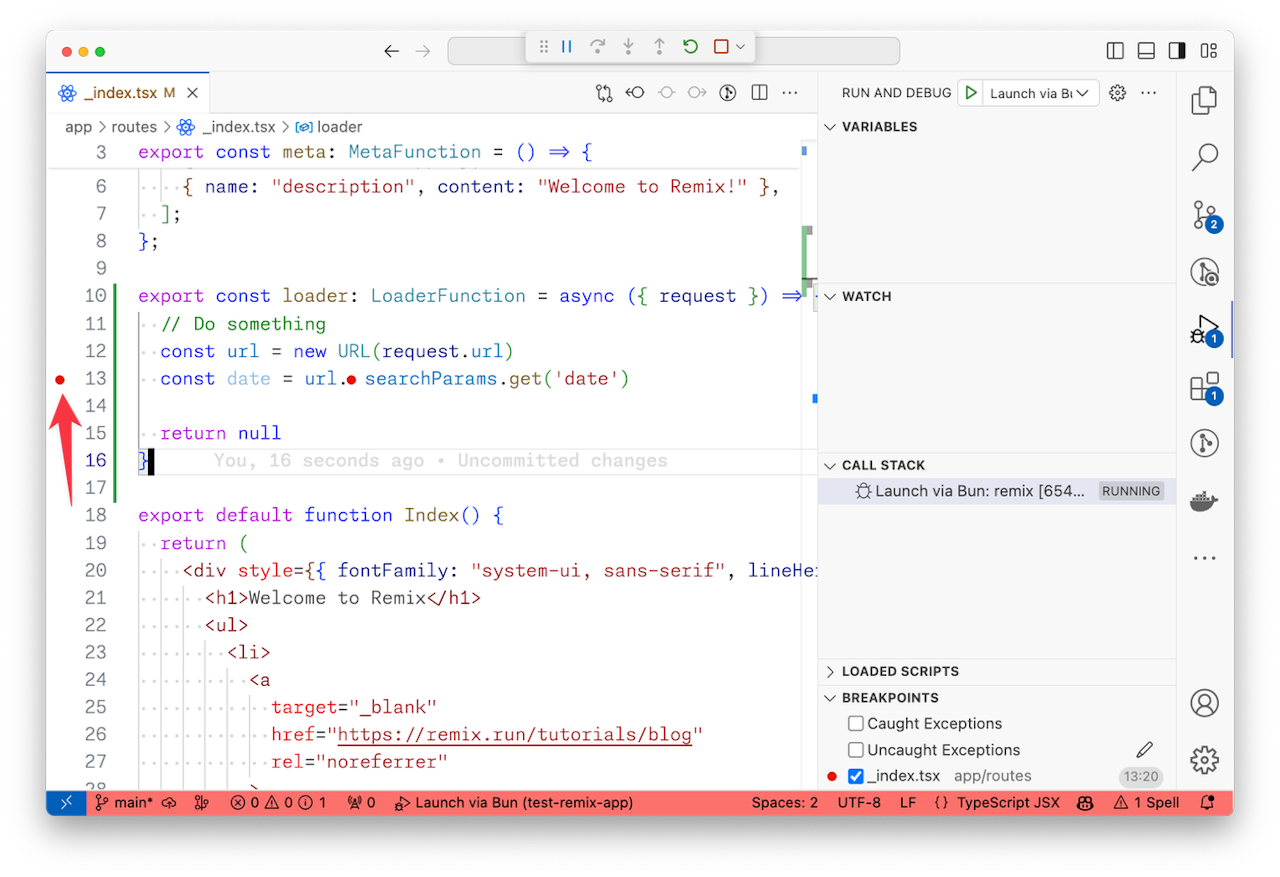
This is a Remix application running in server mode. In a Remix app, we have the concept of "loaders", which are functions we export inside a page file that runs in the server.
export const loader: LoaderFunction = async () => {
  return null
}
For the purpose of this guide, I won't add fancy code. I'll check the URLSearchParams to see if there's something.
To add a breaking point, all you need is to click beside the line number:
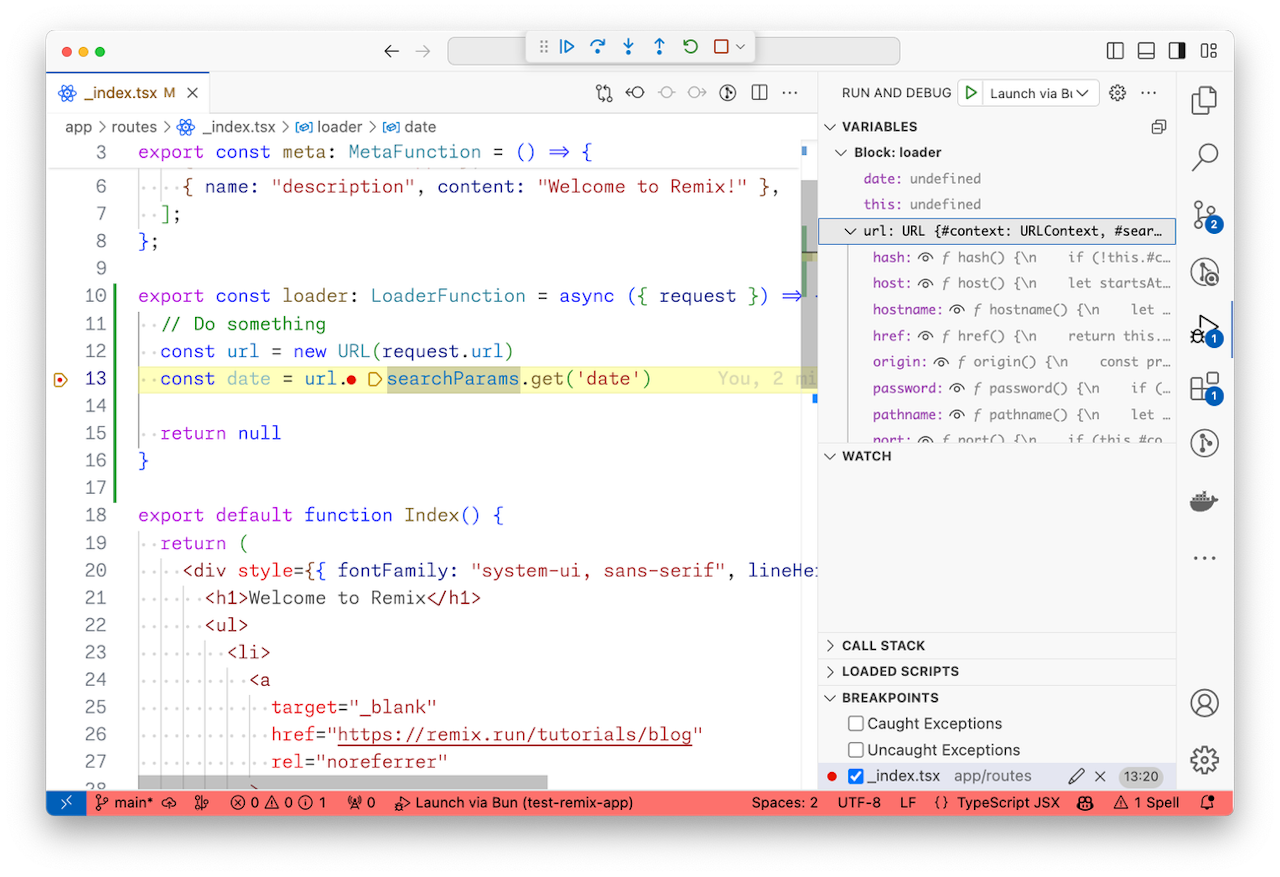
Now, when we reload the page, because we added this breaking point, the code execution will stop there when we inspect the data:
Conclusion
There are cases (maybe most of the cases) where a simple console.log might be just enough, but being able to inspect server code flow might save you plenty of time when trying to catch a bug.
I hope this guide helped you somehow.
Cheers.